
Visualize yMMSL workflow as Scalable Vector Graphics (SVG).
This tool takes a yMMSL model (from a v0.2 yMMSL file) and generates an SVG image to represent it.
- Visualize the coupling diagram for yMMSL (sub)models
- Call/release (a.k.a. macro-micro) coupling
- Dispatch coupling
- Visualize component ports: F_INIT ports are drawn on the left side of a component as an open diamond, O_F ports on the right side as a closed diamond, and O_I and S ports on the bottom as respectively a closed and an open circle.
- Visualize model ports: F_INIT ports on the left side of the model, O_F ports on the right side. Model O_I and S ports are not (yet) supported.
- Visualize "multi-cast" conduits, where one output port sends to multiple input ports.
- Draw conduits with filters.
Note that not ymmsl2svg cannot visualize all valid yMMSL configurations, see
Roadmap for a brief overview of missing functionality.
Click to open the image in a new tab and enable interactive features, such as tooltips with the port name when hovering over a port.
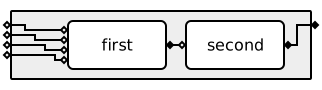
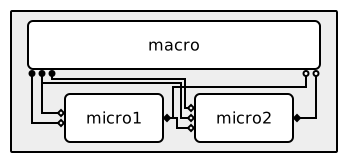
ymmsl2svg is available on PyPI and can be
installed with pip:
pip install ymmsl2svg# Create 'workflow.svg' image from the root model in 'workflow.ymmsl'
ymmsl2svg workflow.ymmsl -o workflow.svg
# Show supported options and settings
ymmsl2svg --helpymmsl2svg-live shows the diagram of a yMMSL file in your browser and re-renders it
every time you save the file, so you can edit yMMSL in your favourite text editor with
a live preview next to it. If you save a file with errors, the error message appears
above the last working diagram. If there is no working diagram yet, you see just the
error until you fix it. It works on Linux, macOS and Windows (including WSL).
To use it on your own computer, run:
ymmsl2svg-live workflow.ymmslThis opens the viewer in your browser. If no browser opens (for example on WSL), copy
the address printed in the terminal, http://127.0.0.1:8765, into your browser. Use
--no-open-browser if you don't want a browser to open automatically. If that address
is already in use, choose another number with --port, for example --port 12345.
Use --debug to enable debug visualizations. Run ymmsl2svg-live --help for all
options.
ymmsl2svg currently cannot visualize any valid yMMSL model yet, this section
provides a brief overview of missing features that we would like to implement in the
future:
- Missing yMMSL features
- Command Line Interface
- Allow selecting a specific model in the yMMSL configuration (currently only the root model is visualized).
- Allow changing settings / parameters from the Command Line interface.
- Additional features
- Interactive highlight of connected conduits when hovering over components or ports.
- Add an option to draw parallel components under eachother.
1: The SVG generation currently fails for models containing
this.
2: An SVG is generated for models containing this, but a warning
is logged and the visualization is not complete.
Copyright 2026 ITER Organization. The code in this repository is licensed under the Apache-2.0 license