
Introduction to Computational Methods for the Geospatial Visualization of Political Parties and Elections 

This repository contains the codes and materials used in this workshop, delivered as part of the Political Parties and Elections course in the Bachelor’s Degree in Political Science at the Federal University of Pernambuco (UFPE, Brazil), under the supervision of Leon Victor Queiroz (PhD).


To get the most out of this course, you should already have a basic understanding of R and RStudio, as well as a working knowledge of the tidyverse for data manipulation and visualization. If you do not have these prerequisites, the following resources are recommended to help you get up to speed.
Grolemund, Garrett. Hands-on programming with R. " O'Reilly Media, Inc.", 2014.
Mais informações podem ser encontradas em tidyverse.org
- Motivation to learn data visualization
- Some real applications, if time permits
- Introducing Structured Data Elements
- Why use these packages?
- Grammar and Syntax Review of
ggplot2 - Spatial Data and Geographic Data Handling
- Understanding spatial data
- Brazilian Geographic Data
- Map Creation and Customization
WICKHAM, Hadley. ggplot2: elegant graphics for data analysis. New York: Springer, 2009. (Use R!). ISBN 978-0-387-98140-6. DOI: 10.1007/978-0-387-98141-3.
Wickham H (2014). Dados organizados. Journal of Statistical Software. Volume 59, Edição 10.
if (!require(pacman)) {
  install.packages("pacman")
}

pacman::p_load(tidyverse,
               geobr,
               sf,
               patchwork)
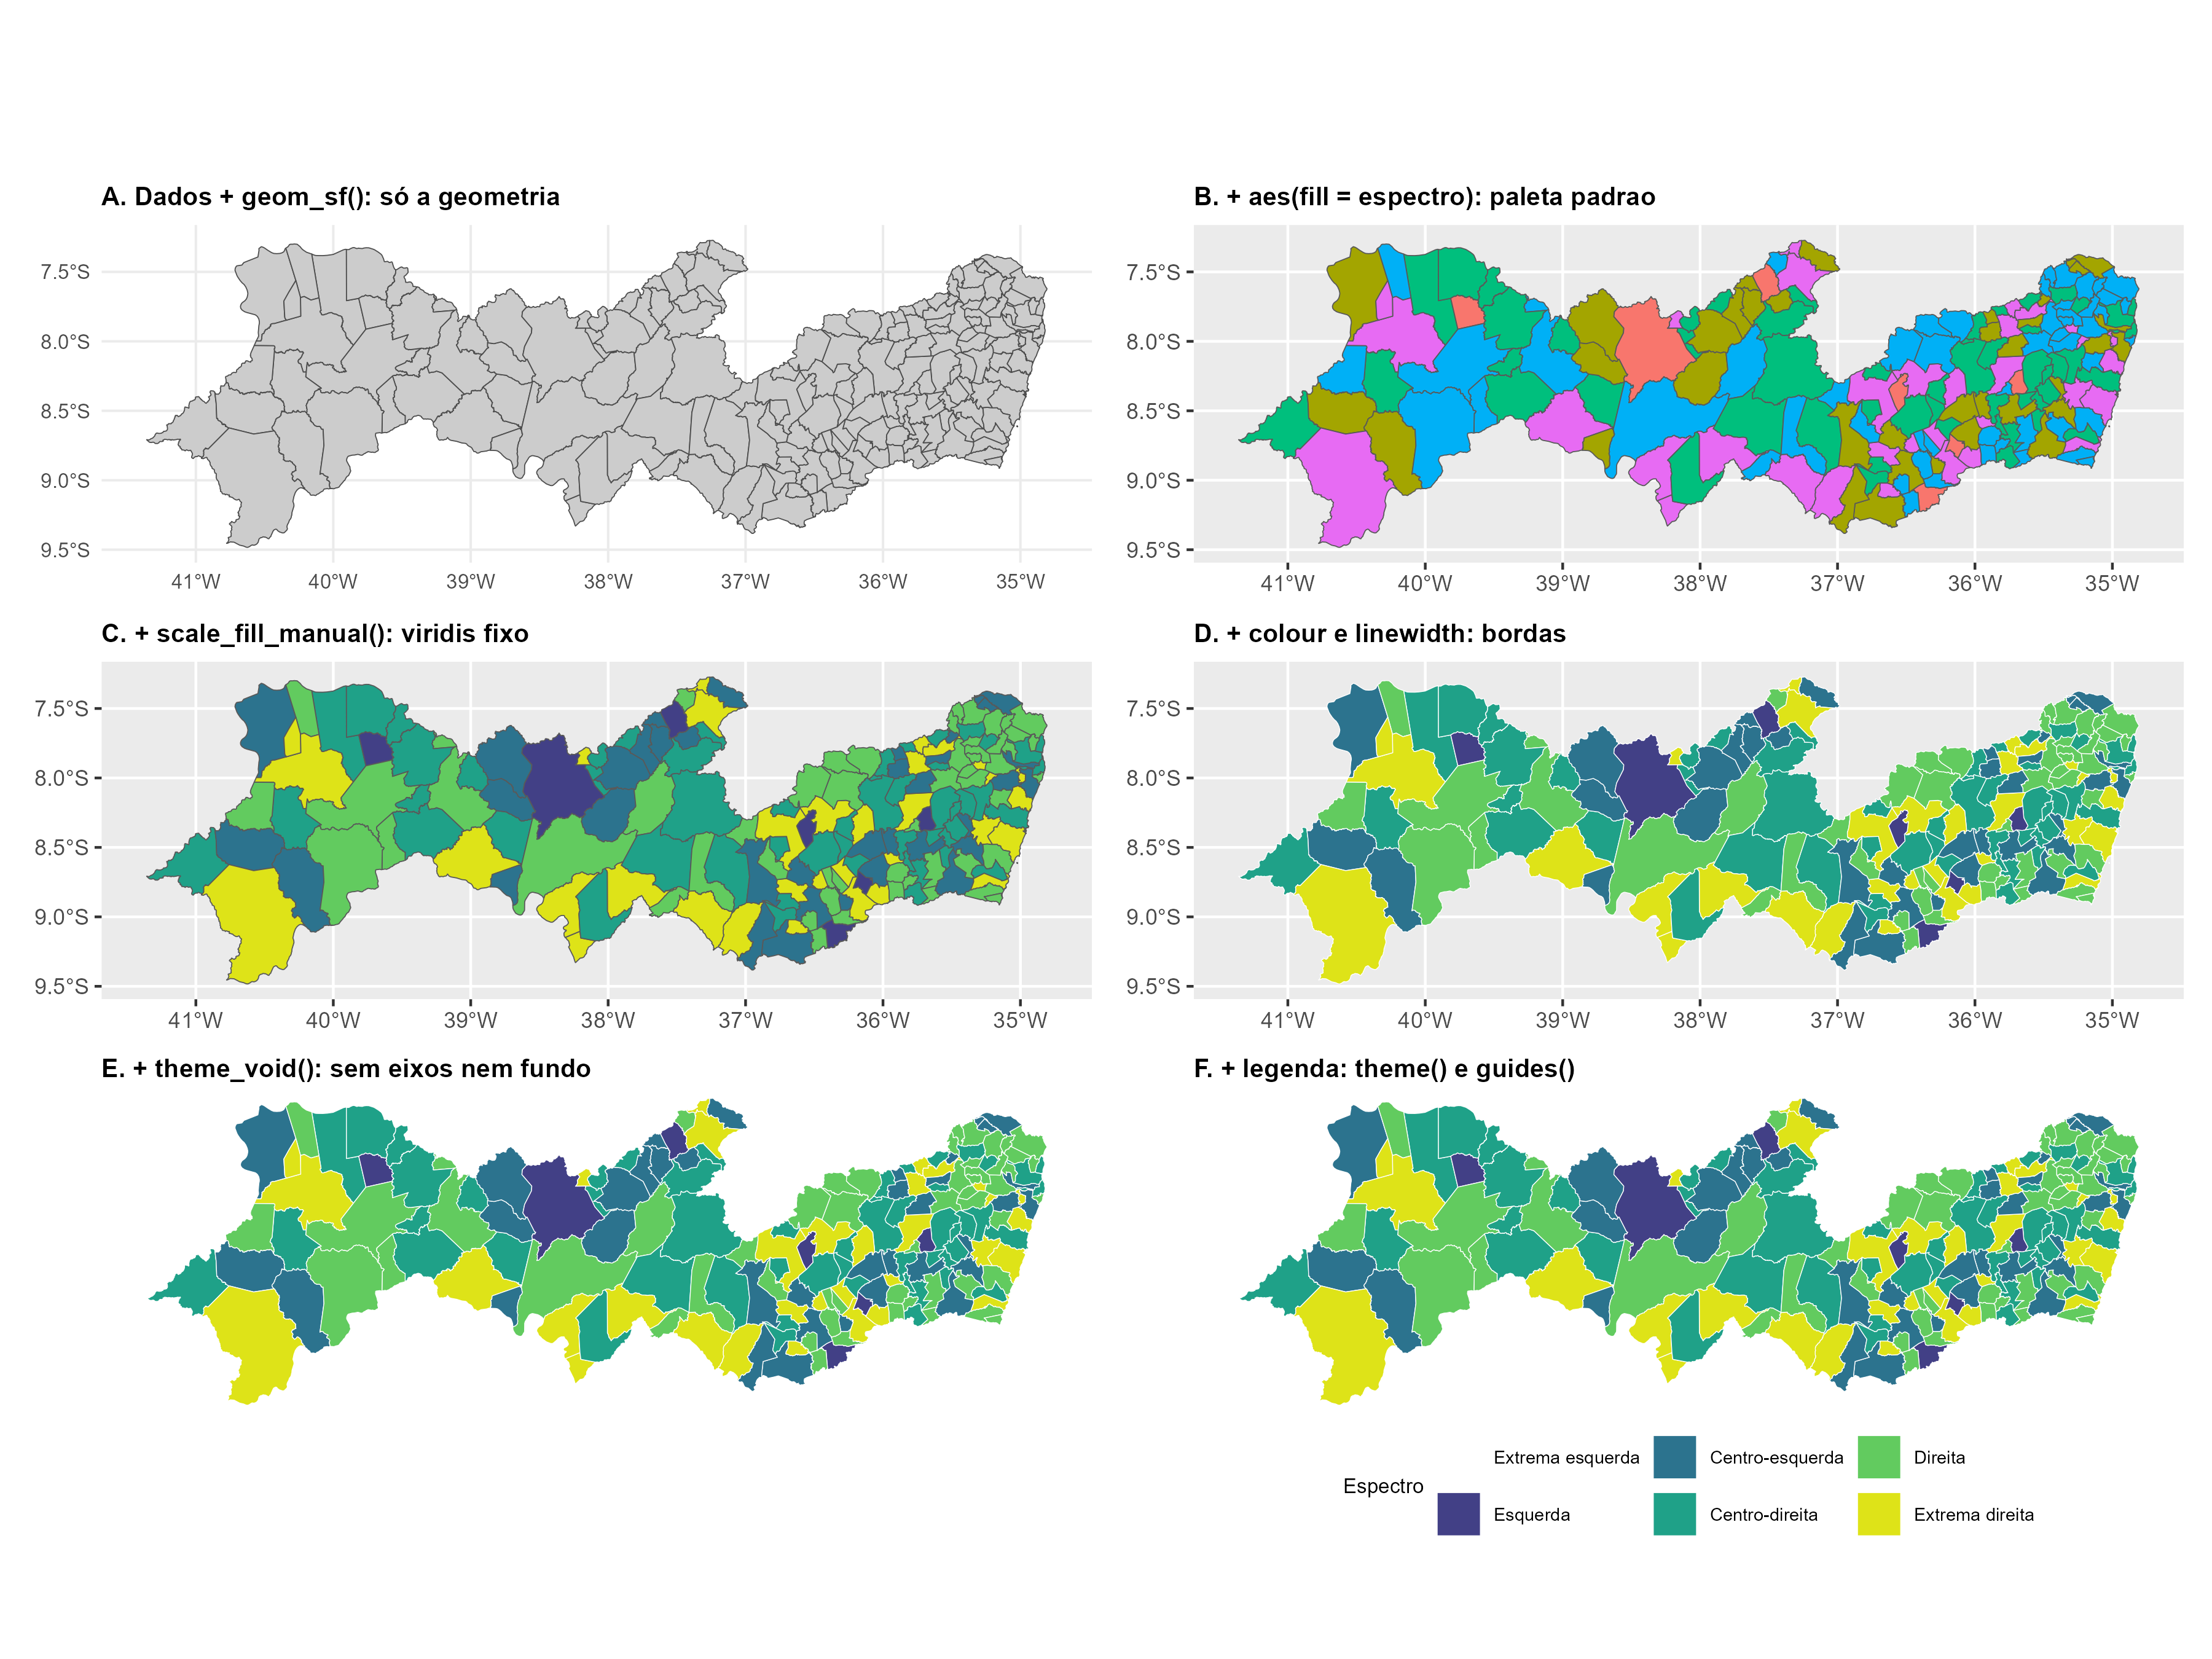
As análises foram realizadas no R, utilizando o pacote {tidyverse} para manipulação dos dados (WICKHAM et al., 2019; principalmente usando o {dplyr} e {ggplot}), adiante o pacote {geobr} para obtenção das malhas territoriais do Brasil (PEREIRA; GONCALVES, 2024) e o pacote {sf} para o tratamento dos dados espaciais (PEBESMA, 2018; PEBESMA; BIVAND, 2023). Os mapas foram elaborados com a paleta de cores do pacote {viridis} (GARNIER et al., 2024) e combinados com o pacote {patchwork} (PEDERSEN, 2025).
This repository holds two processed datasets for the 2024 municipal elections in Pernambuco (PE). Both attach the same ideological classification of parties and the same IBGE geography to TSE data, but they differ in the unit of observation.
| File | Unit of observation | TSE source table | Processing script |
|---|---|---|---|
data/votacao_ideo.csv |
one row per party, per municipality, per office, per round | Votação por partido, município e zona (votacao_partido_munzona_2024_PE) |
vereador.R |
data/prefeitos_eleitos.csv |
one row per elected mayor (= one row per municipality) | Votação por candidato, município e zona (votacao_candidato_munzona_2024_PE) |
prefeitos.R |
- Sources: Brazilian Superior Electoral Court (TSE) for votes; Bolognesi, Codato, Ribeiro and Silva (2025), Harvard Dataverse, doi:10.7910/DVN/MFIXKW, for party ideology; IBGE for municipal codes and mesoregions.
- Aggregation: both TSE tables have one row per electoral zone. In both datasets, zones were summed within municipality.
- Missing values: in the TSE source,
-1= blank in the TSE database and-3= not applicable to that election year; both were converted toNAbefore summing and are ignored in the sums (so a sum over only-missing values becomes0).code_muni,mesorregiao,ideologia_mediaandespectrohave no missing values in either file: the processing scripts stop if any municipality or party fails to match. - Encoding: original TSE files are in Latin-1, read as such and saved as UTF-8 (CSV, comma-separated,
NAwritten as an empty cell).
- Unit of observation: one row per party, per municipality, per office, per round.
- Subset: all rows of the TSE party-level file for PE, 2024. No filtering by office or round was applied in processing;
DS_CARGOandNR_TURNOare kept so each analysis can choose its own subset. The vereador plots in this project useDS_CARGO == "Vereador"andNR_TURNO == 1. - Zero votes: rows with
votos_total = 0are kept. The plots remove them only where a logarithmic scale requires it.
- Unit of observation: one row per elected mayor.
- Subset: mayor (
Prefeito) only; elected candidates only (ELEITO); 2024; PE only. The mayor comes from the round in which he or she was elected (first round, or second round where there was a runoff). Vice-mayors are excluded. Fernando de Noronha does not elect a mayor, so 184 rows are expected (the script stops if a municipality has more than one elected mayor, and warns if the total is not 184).
The column In says which dataset has the variable: V = votacao_ideo, P = prefeitos_eleitos.
| Variable | In | Type | Description | Values / Notes |
|---|---|---|---|---|
ANO_ELEICAO |
V, P | integer | Election year | 2024 only |
SG_UF |
V, P | text | State where the election took place | PE only |
SG_UE |
V, P | text | Electoral unit the candidate or party ran in | TSE municipality code (municipal elections) |
NM_UE |
V, P | text | Name of the electoral unit | Municipality name, as in the TSE file |
CD_MUNICIPIO |
V, P | integer | TSE municipality code | Not the IBGE code. The crosswalk to IBGE is code_muni |
NM_MUNICIPIO |
P | text | Municipality name | As in the TSE file |
code_muni |
V, P | integer | IBGE municipality code | 7 digits. Created for this project by joining CD_MUNICIPIO to a TSE-IBGE crosswalk (betafcc/Municipios-Brasileiros-TSE); not part of the TSE layout. Use it to join with geobr |
mesorregiao |
V, P | text | IBGE mesoregion of the municipality | Created for this project via geobr::lookup_muni(). Values: Metropolitana de Recife, Mata, Agreste, Sertão, São Francisco (the suffix "Pernambucano/a" was removed). This is the IBGE division used before 2017 |
DS_CARGO |
V | text | Office sought | As in the TSE file (e.g. Vereador). Not kept in prefeitos_eleitos, where it is always Prefeito |
NR_TURNO |
V, P | integer | Election round | In V: the round the votes refer to. In P: the round in which the mayor was elected (1, or 2 when there was a runoff) |
SQ_CANDIDATO |
P | text | Internal TSE candidate ID | Unique within a single election only; changes across elections |
NM_URNA_CANDIDATO |
P | text | Candidate's ballot name | Name as it appeared on the ballot; not a unique identifier |
SG_PARTIDO |
V, P | text | Party abbreviation | In V: the party to which the votes were counted. In P: the elected mayor's own party, not the coalition. Spelled as in the TSE file (e.g. PC do B, UNIÃO) |
ideologia_media |
V, P | numeric | Expert-survey ideological position of the party | Created for this project. Weighted mean from Bolognesi et al. (2025), Table 1 (2022 wave, weighted by the 2018 position). Scale 0 (extreme left) to 10 (extreme right). Name matches: MOBILIZA = PMN, PP = Progressistas (PROGRE), SOLIDARIEDADE = SDD, CIDADANIA = CDD, REPUBLICANOS = REP. PRD is not in the article: its value (8.409) is an estimate, the arithmetic mean of its predecessors PTB (7.955) and Patriota (8.862), the same rule the authors used for mergers |
espectro |
V, P | text | Ideological category of the party | Created for this project. Cut-offs from Bolognesi et al. (2025) applied to ideologia_media: up to 1.5 = Extrema esquerda; 1.51–3 = Esquerda; 3.01–4.49 = Centro-esquerda; 4.5–5.5 = Centro; 5.51–7 = Centro-direita; 7.01–8.5 = Direita; above 8.5 = Extrema direita. No party falls in Centro, so that level is empty. The cut-offs are arbitrary: a party just above one (e.g. UP, 1.68) lands in the next category |
votos_legenda |
V | integer | Valid party-label votes | Sum of QT_VOTOS_LEGENDA_VALIDOS over all zones. Applies to proportional offices (vereador); not meaningful for mayor, which is a majoritarian election |
votos_nominais |
V | integer | Valid votes for the party's candidates | Sum of QT_VOTOS_NOMINAIS_VALIDOS over all zones. Excludes annulled votes |
votos_total |
V | integer | Valid votes for the party | votos_legenda + votos_nominais |
votos_candidato |
P | integer | Valid votes for the elected mayor | Sum of QT_VOTOS_NOMINAIS_VALIDOS over all zones, in the round shown in NR_TURNO. Excludes annulled votes |
votos_validos_turno |
P | integer | Valid votes in the municipality, in that round | Created for this project. Sum of votos_candidato over all mayoral candidates of the municipality in the same round. Excludes blank and null votes; it is the denominator of pct_votos |
pct_votos |
P | numeric | Elected mayor's share of valid votes | Created for this project. 100 * votos_candidato / votos_validos_turno, from 0 to 100. Above 50 means an absolute majority |
CSV does not store factors, so the order of mesorregiao and espectro must be restored on reading:
ordem_meso <- c("Metropolitana de Recife", "Mata", "Agreste", "Sertão", "São Francisco")
ordem_espectro <- c("Extrema esquerda", "Esquerda", "Centro-esquerda", "Centro",
                    "Centro-direita", "Direita", "Extrema direita")

votacao_ideo <- readr::read_csv("data/votacao_ideo.csv", show_col_types = FALSE) |>
  dplyr::mutate(mesorregiao = base::factor(mesorregiao, levels = ordem_meso),
espectro = base::factor(espectro, levels = ordem_espectro))- The ideology is the party's, not the candidate's or the mayor's.
espectroclassifies the party label, using a 2022 expert survey. Inprefeitos_eleitosit says nothing about the mayor's own positions, and a small-party mayor may have been elected with support from parties in other camps (coalitions are not in these files). - The classification is dated. Bolognesi et al. (2025) classify parties as of July 2022, including the party federations of that time. Later changes are not captured.
- Party shares are not independent. Within a municipality, shares of valid votes sum to 100%, so a party or camp gaining share means others lose it.
- Vereador votes mix two kinds of vote.
votos_totaladds party-label and candidate votes; usevotos_legendaandvotos_nominaisseparately if the difference matters. - The elected mayor depends on the TSE's totalization. The elected candidate is the one whose total situation in the round starts with
ELEITO, so it can differ from the final outcome in cases decided later by courts.
GARNIER, Simon et al. viridis(Lite): colorblind-friendly color maps for R. Versão 0.6.5. [S. l.]: CRAN, 2024. Pacote R. DOI: 10.5281/zenodo.4679423. Disponível em: https://sjmgarnier.github.io/viridis/. Acesso em: 24 set. 2026.
INSTITUTO BRASILEIRO DE GEOGRAFIA E ESTATÍSTICA. Divisão regional do Brasil em regiões geográficas imediatas e regiões geográficas intermediárias: 2017. Rio de Janeiro: IBGE, 2017. 82 p. Disponível em: https://biblioteca.ibge.gov.br/index.php/biblioteca-catalogo?view=detalhes&id=2100600. Acesso em 27 de set. 2026
PEBESMA, Edzer. Simple features for R: standardized support for spatial vector data. The R Journal, [s. l.], v. 10, n. 1, p. 439-446, 2018. DOI: 10.32614/RJ-2018-009.
PEBESMA, Edzer; BIVAND, Roger. Spatial data science: with applications in R. Boca Raton: Chapman and Hall/CRC, 2023. DOI: 10.1201/9780429459016.
PEDERSEN, Thomas Lin. patchwork: the composer of plots. Versão 1.3.2. [S. l.]: CRAN, 2025. Pacote R. DOI: 10.32614/CRAN.package.patchwork. Disponível em: https://CRAN.R-project.org/package=patchwork. Acesso em: 24 set. 2026.
PEREIRA, Rafael H. M.; GONCALVES, Caio Nogueira. geobr: download official spatial data sets of Brazil. Versão 1.9.1. [S. l.]: CRAN, 2024. Pacote R. DOI: 10.32614/CRAN.package.geobr. Disponível em: https://CRAN.R-project.org/package=geobr. Acesso em: 24 set. 2026.
WICKHAM, Hadley et al. Welcome to the tidyverse. Journal of Open Source Software, [s. l.], v. 4, n. 43, p. 1686, 2019. DOI: 10.21105/joss.01686.
The R Graph Gallery (a website showcasing examples of graphs that can be created in R)
Cf. ggplot2 aesthetic specifications at https://ggplot2.tidyverse.org/articles/ggplot2-specs.html and the package's main functions and arguments at https://ggplot2.tidyverse.org/reference/
Cf. the gallery of registered extensions compatible with the package at https://exts.ggplot2.tidyverse.org/gallery/
Cf. O GLOBO. Mapa da votação nos municípios e estados do Brasil — eleições 2022. O Globo, 2022. Disponível em: https://infograficos.oglobo.globo.com/politica/eleicoes-2022/mapa-votacao-municipios-e-estados-do-brasil.html. Acesso em: 7 out. 2026. [real applications]