
Explainable AI-Based Diabetic Retinopathy Screening for Rural PHCs



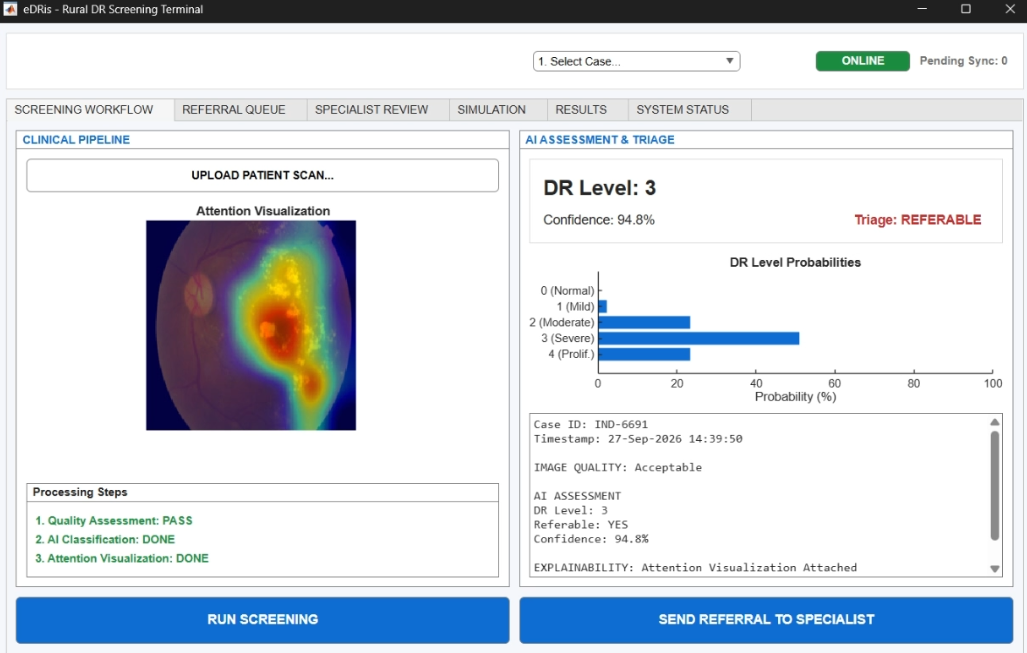
Project: Explainable AI for Diabetic Retinopathy in Rural India
Organization: MathWorks (Problem Statement SIH26038)
Theme: MedTech / BioTech / HealthTech | Category: Software
Diabetic retinopathy is a retinal complication of diabetes that can progress without obvious symptoms in the early stages. In many rural settings, access to specialist eye-care services is limited by distance, availability of ophthalmologists, and connectivity.
Fundus photographs captured at Primary Health Centres (PHCs) can be affected by blur, poor illumination, incomplete field of view, and other acquisition problems. A screening system therefore needs to determine whether an image is usable before classification, provide a clinically interpretable screening result, and continue operating when network connectivity is limited.
The eDRis Solution:
eDRis is an advanced, edge-first screening workflow designed for PHCs. It accepts a fundus image, performs mathematical image-quality assessment, enhances usable images, analyses retinal structures, classifies DR into the International Clinical DR severity levels 0–4 using a ResNet-50 model, generates attention and confidence information, and produces a screening report. Referable cases (DR Level ≥ 2) are placed into a local referral queue and synchronized to a server when connectivity becomes available.
The eDRis architecture connects the AI model directly to the actual constraints of rural screening deployment. The clinical path is separated from the deployment simulation path. MATLAB handles image processing and inference, while Simulink models the flow of patients and resources.
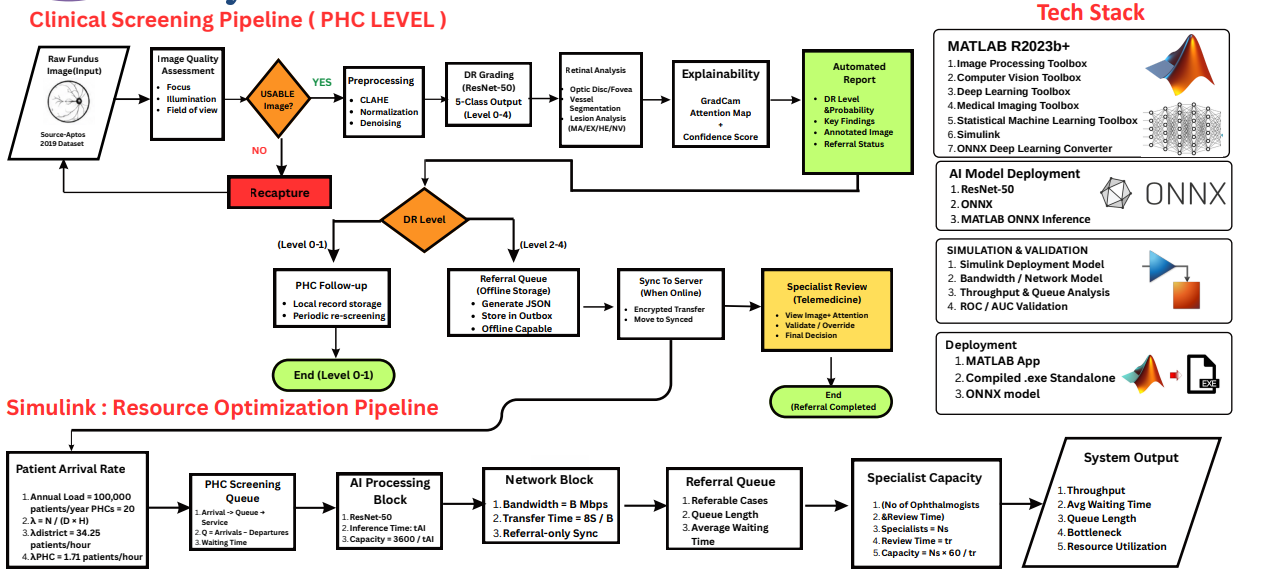
Image quality assessment is placed before AI inference because a visually poor fundus photograph can produce an unreliable classification. A failed image is not silently classified; it is sent back for recapture.
We use the variance of the Laplacian to quantify high-frequency image detail. For a grayscale image
The variance of the Laplacian is then calculated as:
The mean intensity (
Let
The three quality dimensions are represented by normalized scores Usable = 1 if Usable = 0.
Accepted images undergo Contrast Limited Adaptive Histogram Equalization (CLAHE) to improve local contrast without excessive amplification:
The primary classification model is a ResNet-50 network imported through ONNX, mapping to the International Clinical DR scale (Level 0 to Level 4).
Referable DR Logic: For the screening workflow, Level 2 or higher is treated as referable:
-
Referral = 1, if DR Level$\ge 2$ -
Referral = 0, otherwise
The screening report combines DR level, model confidence, quality status, key findings, and an Attention Visualization.
- Extracts high-activation layer maps during inference to visually highlight specific retinal regions (e.g., hemorrhages, exudates).
- Clinicians receive interpretable, localized diagnostic evidence alongside the raw probability score.
Continuous internet access is not a prerequisite. The PHC device performs local inference and stores referral information in an outbox JSON file. When connectivity becomes available, queued referral records are synchronized to the central specialist server.
Simulink is used to represent the deployment behavior of the screening network, modeling how patient arrivals move through acquisition, AI processing, network sync, and specialist review.
Assuming 365 operating days and 8 operating hours/day:
If the mean processing time per image is
For an image of
If
| Aspect | Cloud-first | eDRis Edge-first |
|---|---|---|
| Inference | Remote / server | Local PHC device |
| Image transfer | All screening images | Referral-focused synchronization |
| Connectivity | Important for routine inference | Not required for basic local screening |
| Referral handling | Server-side | Local outbox + later sync |
| Resource model | Network / server dependent | Network + AI + queue + specialist capacity |
The current prototype has been verified through a deterministic ONNX inference path using a 551-image APTOS 2019 holdout set.
-
Referable Definition: DR Level
$\ge 2$ - Threshold: 0.620
- AUC-ROC: 0.9748
- Sensitivity: 94.17%
- Specificity: 93.58%
- Inference Benchmark: 128 ms/image (machine/session dependent)
- Stage 1 (PHC Prototype): Local screening workflow (image capture, quality gate, preprocessing, classification, report).
- Stage 2 (Connectivity): Connect local referral outbox to an online synchronization service.
- Stage 3 (Multi-PHC Simulation): Simulink evaluation of district-scale workload under varying bandwidth and specialist conditions.
- Stage 4 (Clinical Validation): Prospective validation on representative clinical data and regulatory review before real-world deployment.
| Risk | Mitigation / Engineering Response |
|---|---|
| Camera & Image Variation | Quality gate, CLAHE normalization, and recapture pathway. |
| Population Shift | Prospective validation and external evaluation prior to deployment. |
| Poor Connectivity | Local edge inference, local JSON queue, and delayed synchronization. |
| Referral Overload | Simulink specialist-capacity and queue bottleneck modeling. |
| False Reassurance | Use strictly as screening support; maintain specialist review. |
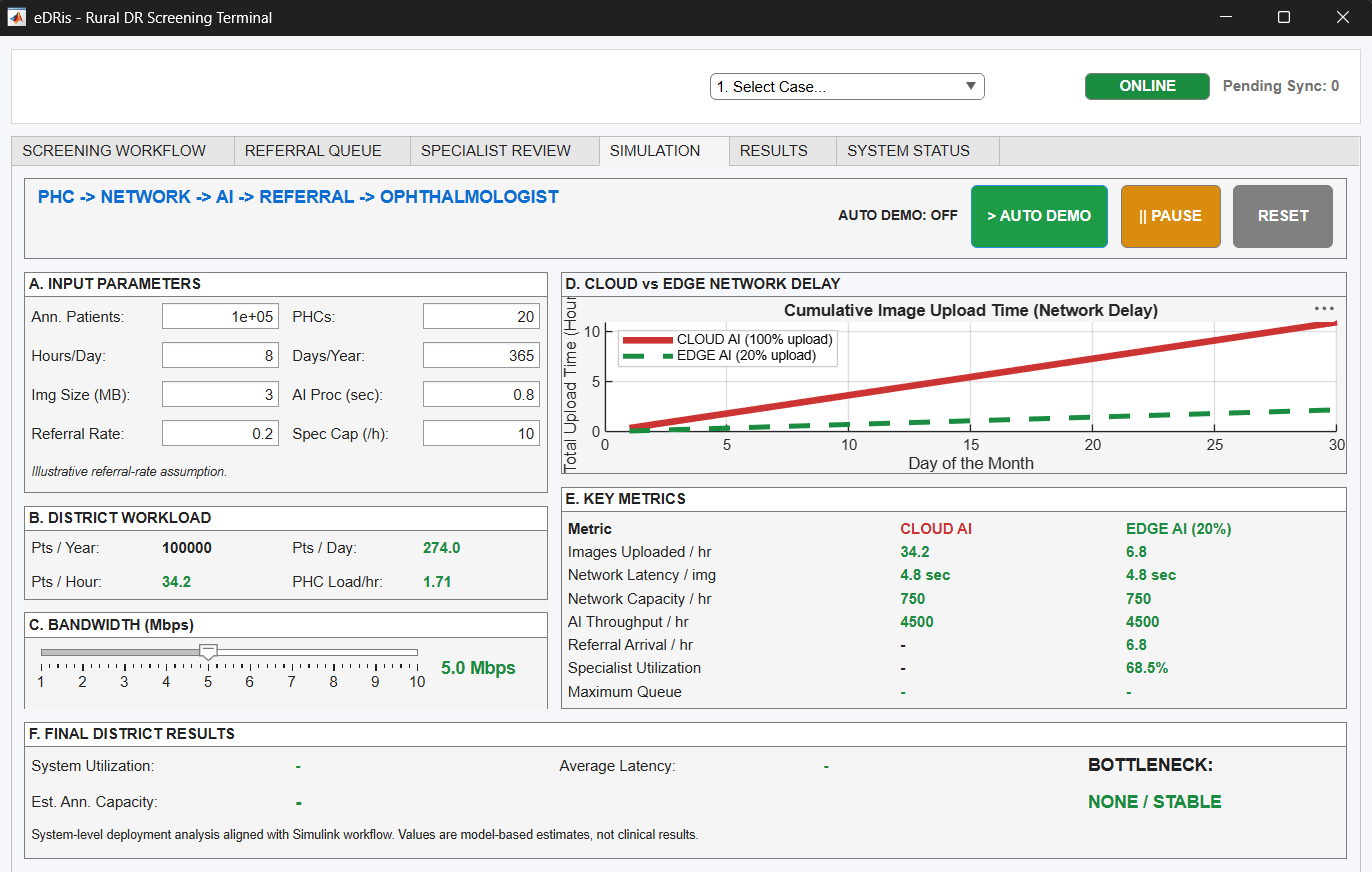
Real-time MATLAB Queue Simulation mathematically proving the bottleneck of Cloud-AI versus the scalability of eDRis Edge-AI in low-bandwidth rural conditions.
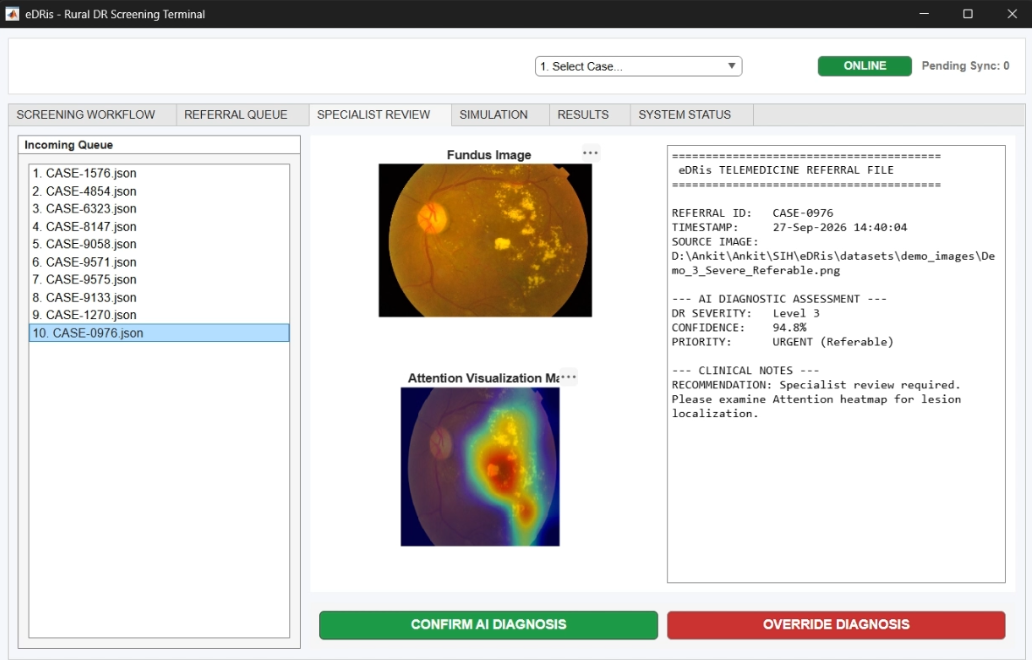
The Centralized Specialist Review UI for offline-synced JSON payloads, enabling rapid triage and verified medical diagnosis.
- Application: MATLAB
- Deployment Modelling: Simulink
- Model Interoperability: ONNX
- Primary Classifier: ResNet-50 (5-class DR severity)
- Image Processing: MATLAB image-processing toolboxes
- Referral Storage: Local JSON outbox / sync workflow
- Clone this repository.
- Open MATLAB R2023b or newer.
- Ensure you have the following Toolboxes installed:
- Deep Learning Toolbox
- Deep Learning Toolbox Converter for ONNX Model Format
- Image Processing Toolbox
- Navigate to
src/matlab/and run the core pipeline scripts.
This project is licensed under the MIT License. See the LICENSE file for details.